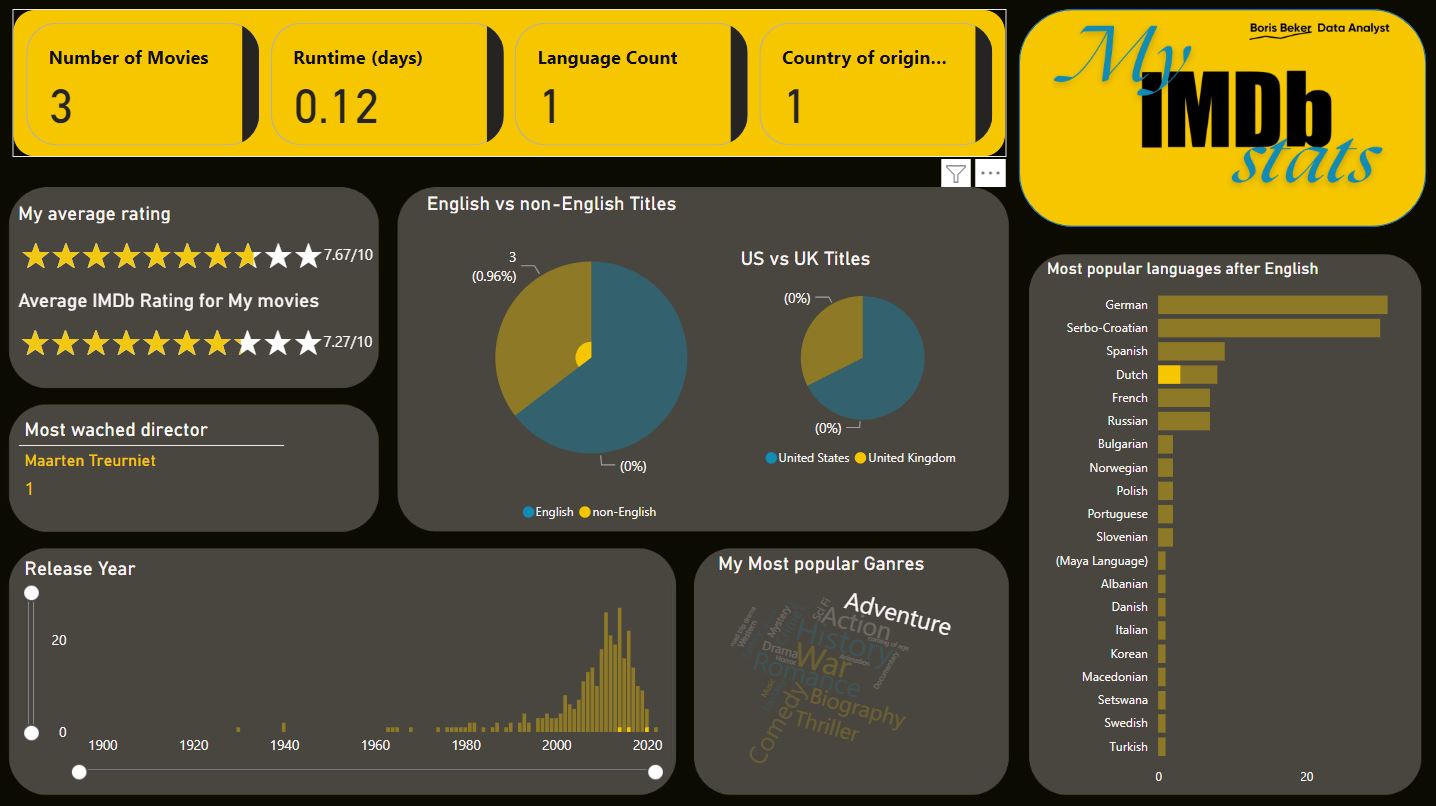
My IMDB Statistic Power BI
For this dashboard, I used data from my personal IMDB account so it is meant to showcase my skills in using Power BI
but also tell a little bit about me through my move stats.
The dashboard is interactive s when you click on for example "Dutch" the dashboard will readjust to show just stats relevant to Dutch movies,
when you click "Adventure" it will show just stats for Action movies and if I click on "Dutch" and "Adventure" it will show stats for Dutch action movies.
The colors used in this dashboard are colors from the original IMDB color schema.
The first step was to familiarise myself whit the data provided to see if data needed to be "cleaned" or reformated.
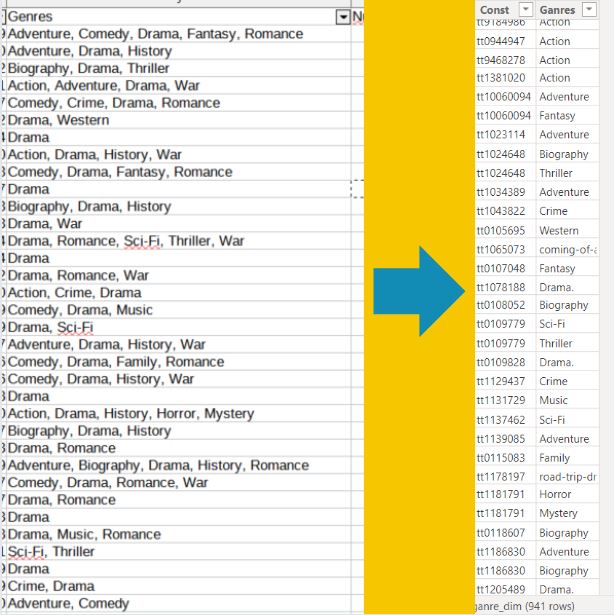
The first thing that I noticed is that if movie belong to more than one genre (and most of them do) all genres are stored in one cell which is not adequate.
I split genre column into multiple columns and move them to there on designated table toghether with the id column and then I unpivoted genres column and
via a id column, I connected the genre table to the original table.
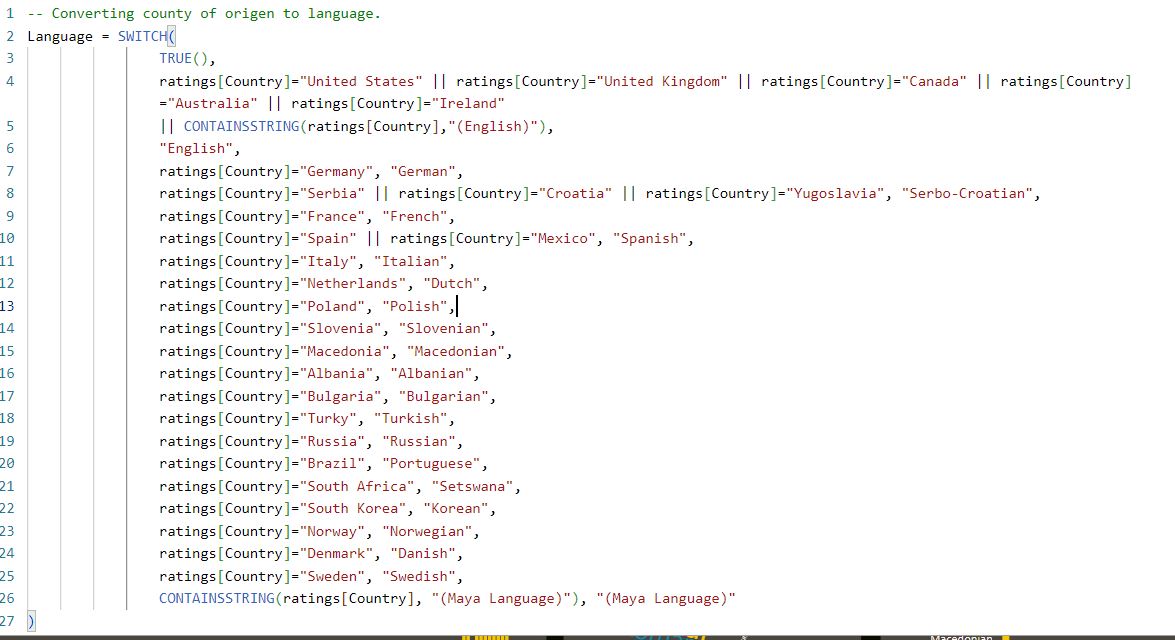
After that I needed to create some calculated measures and calculated tables using DAX.
Because I did not have a language column I needed to create that from the country of origin, I needed to convert Runtime(minutes) to Runtime(days)
and also I needed to create a calendar table from 1900 to now to show relice year graph.
Also, for the English vs non-English pie chart, I needed to group all languages that are not in English so I would get one big pie slice and not 20 small ones.
Some visualisations like stars visualizations and word cloud are not standard Power BI so they needed to be imported into Power BI
in order to be used.
In the end I needed to prepare the background for visualizations and arange them in a meaningfull and visually pleasing way, I did that using Power BI but also using Canva.
As I wrote above, colors used in this dashboard are colors from the original IMDB color schema.